The whole thing in one paragraph
TL;DRCockpit — the app you're in right now — is the operating layer for a barbell-style real-estate portfolio. Intel ingests every signal (verbal, written, external comms; property performance; market and trend data) and routes it here, where it's packaged into blindspots and decisions ranked by $-impact. Knowledge reflects the personal layer — tasks, commitments, decisions — so nothing falls through. Box and Runner sit behind for long-tail storage and the workshop where new agents and pipelines get built. Brick the AI is the guiding force that holds the barbell overhead — capping risk on one end while pushing value on the other.

The Barbell Thesis
Value-Add Real EstateCap the downside on one end. Push the upside on the other. Brick is the guide that keeps the bar level — managing the spiked RISK plate and the gold REWARD plate so neither side tips the operator.
See it before it sees us
- •Continuously monitor every data stream for blindspots — surfacing emerging risks before they become known problems, then routing them into Brickston where they're translated into actionable insight against the live property graph.
- •Track the health of every relationship — partners, lenders, residents, and each other — through sentiment, response cadence, and follow-through on deliverables, so a quiet warning never goes unheard.
- •Use knowledge-graph visuals to alert ourselves and the team the moment we drift — too much time on low-leverage work, neglected accounts, or under-served properties — so attention snaps back to where it actually moves the needle.
Spend the day on what compounds
- •Concentrate our time on the value-add work — repositioning, capital events, market timing — and let the platform absorb the operational minutiae that used to eat the calendar.
- •Make decisions with confidence: every recommendation is anchored to live data, ranked by $-impact, and packaged so the call takes minutes instead of meetings.
- •Manage tasks, prioritize the queue, and share the information that matters — every artifact organized, retrievable, and one click away for the people who need it next.
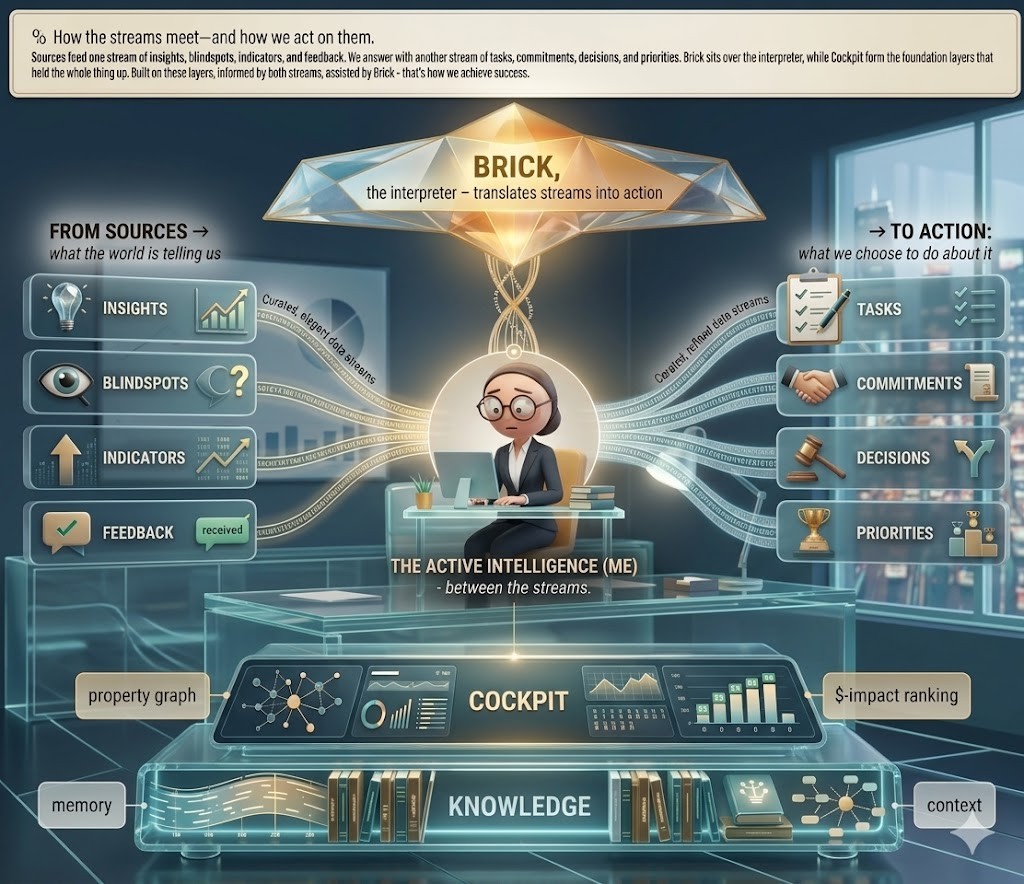
How the streams meet — and how we act on them
Sources feed one stream of insights, blindspots, indicators, and feedback. We answer with another stream of tasks, commitments, decisions, and priorities. Brick sits over the top as the interpreter, while Cockpit and Knowledge form the foundation layers that hold the whole thing up. Built on those layers, informed by both streams, assisted by Brick — that's how we achieve success.
Source Impact Matrix
0 sources · per-feed risk + value frameworkHow each Items Hub feed affects portfolio risk and value, the metric to track, and the threshold for action. Click a source to see Brick's suggested questions — each is a one-click deep-link into chat.
Decision support
Planned — variance drivers, suggested filters, and anomalies
This strip will highlight what needs attention, link to underlying metrics, and (optionally) label insights with provenance — matching the Stitch Command Center insight pattern.
No automated signals are shown until portfolio data and rules are connected.